Blogger Widgets

Monday, November 12, 2012

NFL Playoff Picture: Week Ten

What an interesting week in the NFL. All six of the playoff picture teams from last week on the AFC side won while the teams trying to move into the picture (Chargers and Dolphins) both lost. On the NFC side, none of the division leaders won while the Packers were on a bye and the Seahawks won. In the end, nothing changed in the picture (including seedings).

Starting off with the AFC, the Patriots added a game to their lead over the Dolphins in the East giving them a two game lead. Up North, both the Ravens and Steelers won keeping Baltimore's lead at one. Their face-off in Sunday Night Football will determine who has the division lead. The Texans and Colts both won in the South, and so, Houston maintains a two game lead. Only the Broncos won in the West increasing their lead over San Diego to two games.

The Colts and Steelers are the only other AFC teams with a winning record. Indianapolis has the better conference record (4-2 versus 3-3) and thus gets the higher spot.

The Texans at 8-1 have the top spot. The 7-2 Ravens follow. The Patriots and Broncos are tied at 6-3, and since New England won the head-to-head match up, so they get the #3. The AFC picture is still:

On the NFC side, the Giants lead is down to 1.5 game with their loss and the Cowboys win over the Eagles. The Bears now lead the Packers by just a game in the North. After losing, the Falcons lead over the Buccaneers is just three games. After tying the Rams, the 49ers now lead the Seahawks by just a game in the West.

The Packers have the best records of the non-division leading teams and have the #5 seed. Seattle and Minnesota are tied for the next best record, and with the head-to-head victory, the Seahawks get the nod.

The division leaders all have different records, and lining them up in order is easy: Atlanta, Chicago, San Francisco, then New York. The NFC playoff picture is:

Looking ahead to next week, all of the current AFC playoff teams are safe although there is opportunity for some of the teams to shuffle around seeds. On the NFC side, all of the division leaders will be in the picture next week (the Bears could lose their division lead) and Seattle is safe while off on a bye. The Packers have the best chance for the last spot: if they win, they keep it. If the Packers lose, the Buccaneers can take the spot with a win. If both the Packers and Bucs lose, the Vikings who will be on a bye take the spot. Additionally it should be noted that Green Bay overtakes the lead in the North with a win and a Chicago loss.

Week 11's top games feature the Bears versus the 49ers, Indianapolis at New England, and the Ravens travelling to Pittsburgh to take on the Steelers with the AFC North lead on the line.

Sunday, November 11, 2012

My Where's George Week in Review: 11/04/12 - 11/10/12

In the past week, I received 28 hits in 11 States [CA17, FL, GA, MI, MO, NV, NY, PA, TX2, VA, WI]. I still have hits in 44 States in 2012 with none added this week. Additionally I now have hits in 477 counties with 4 new this week: Henry GA, Cole MO, Roanoke City VA, Marathon WI.

Of those 28 hits, 3 were the 2nd hit on the bill and the rest (25) were the initial hit on the bill. The longest bill active from the bunch was re-entered 3 Years 84 Days 15 Hours 38 Minutes after I originally entered it.

SundayMondayTuesdayWednesdayThursdayFridaySaturday
04050607080910
5554423

7 more days with hits extends my current hit streak to 35 days (currently my 7th longest streak all-time).

Taking a look at how my predictions regarding bill entries and hits are going so far, it was a slightly positive week for all stats:

 SoYStart of YearSoWStart of WeekEoWEnd of WeekWeek Change:
Number Added this Week
Year Change:
Number Added this Year
PPrediction (for Year)P/WPrediction for Week:
A Week's Share of the Total
PtDPrediction to Date:
The Portion of the Prediction that should be Completed so Far
WvPWeek versus Prediction:
How the Week's Numbers Stack Up Against the P/W
DvPDate versus Prediction:
How the Year's Numbers So Far Stack Up Against the PtD
Bills Entered1672022165222649955442172095.621023+3+1241
Bills with Hits243035063531251101344519.43304+6+227
Total Hits279940874115281316403023.53858+4+257

Based on the goal of 5000 bill entries, here's how I'm doing towards my bill entry goals. Starting off with my goal of increasing the percentage that $1s make up of my entries by 1% (started the year at 86.29% so the goal is 87.29%), my percentage is now 87.51% [+1.22%]. This goal is looking pretty secure at this point.

 SoYStart of YearSoWStart of WeekEoWEnd of WeekWeek Change:
Number Added this Week
Year Change:
Number Added this Year
GGoal:
Number of Total Ones Needed by the End of the Year Based on the Prediction of 5000 Bill Entries This Year
GfWGoal for Week:
This Week's Portion of the Goal Based on the Number of Bills Entered in the Week
GtDGoal to Date:
The Numbers of One Needed to be Entered so Far this Year to be on Track to Met the Overall Goal
WvGWeek versus Goal:
How the Week's Numbers Stack Up Against the GfW
DvGDate versus Goal:
How the Year's Numbers So Far Stack Up Against the GtD
$1s Entered1442719391194839250561895989.719452+2+31
Dynamic GoalProgress towards the goal based on my actual rate of entering bills per day which would result in 6442 entries this year rather than 5000202178919410+3+73

As for the goal of having series 2009 pass series 2003A in number of entries, it wasn't a great week for 2009s, but I added to it's lead and it's now 350 ahead:

 SoYStart of YearSoWStart of WeekEoWEnd of WeekWeek Change:
Number Added this Week
Year Change:
Number Added this Year
  Week Change:
Number Added this Week
Year Change:
Number Added this Year
WvGWeek versus Goal:
How the Actual WΔ Stacks Up Against the Goal WΔ
DvGDate versus Goal:
How the Actual YΔ Stacks Up Against the Goal YΔ
2003A36033859387112268GoalNumber of Entries Needed Per Timeframe to Stay on Pace for the Year Based on the Predicted Amount of 5000 Bills Entered452511-8+603
2009133946724721493382Actual373114

And for my goal of decreasing San Francisco "L" FRB entries below 50.0% while increasing Boston "A", Cleveland "D", St Louis "H", Philadelphia "C", Minneapolis "I", and Kansas City "J", all of those FRBs but Minneapolis either stayed at the same percentage or went the wrong way but not by enough to be a concern:

 SoYStart of YearSoY%Percentage of Overall at Start of YearSoWStart of WeekSoW%Percentage of Overall at Start of WeekEoWEnd of WeekEoW%Percentage of Overall at End of WeekGoalGoal PercentageGtDGoal to Date:
The Numbers Needed to be Entered so Far this Year to be on Track to Met the Overall Goal
DvGDate versus Goal:
How the Year's Numbers So Far Stack Up Against the GtD
San Francisco "L"853251.03%1059347.79%1064947.83%< 50.0%49.94%11098+449
Boston "A"4612.76%7623.44%7623.42%> 2.8%2.85%637+125
Cleveland "D"3952.36%7833.53%7863.53%> 2.4%2.45%548+238
St. Louis "H"3822.28%7193.24%7203.23%> 2.3%2.35%525+195
Philadelphia "C"3762.25%6392.88%6412.88%> 2.2%2.25%501+140
Minneapolis "I"3522.11%5952.68%5982.69%> 2.1%2.15%480+118
Kansas City "J"2901.73%5522.49%5522.48%> 1.7%1.75%391+161

I was surprised to see that I only had 28 hits in the past week. It had seemed like more since it felt like I was getting a lot of out-of-State hits. Guess my in State hits are less than normal.

Wednesday, November 7, 2012

How I Make My Running Badges

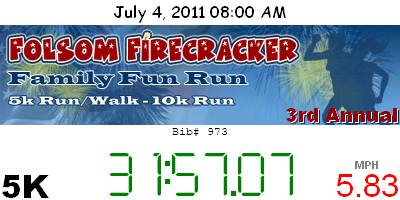
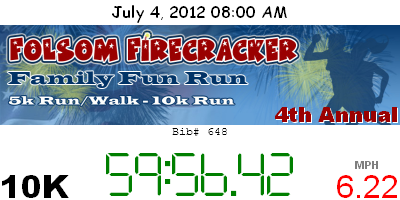
For each race I compete in, I create a "badge" image as a memento to record my participation. I think they make for a nice way to look back on the runs I did, and an easy way to look back on the history of my personal records. Below are the steps I take to make the badges. If you wish to make your own badges, feel free to copy these steps exactly or make alterations as you wish.

Before getting started, you will need a couple of things. First off, you will need image editing software. I use a free software program called Paint .NET. Additionally, I use a font called "LED Font" for my race time:

I'm not 100% where I downloaded the font. The file is called LEDFont.ttf. It looks like it could be the one downloadable here or here. Alternatively, you could use a different font.

Once those two items are addressed, here's what to do:

  1. Launch Paint.NET.
  2. Create a new image with a width of 400 and a height of 200.
  3. Change the current tool to the "Text" tool.
  4. Change the font to “"Comic Sans MS", font size to "12", font color to "black", and text align to "center".
  5. Locate the cursor at (200, 12).
  6. Type the date and time of the race in "MMMM d, yyyy hh:mm tt" format. For example, if I ran a race this morning at 9, I'd type "November 7, 2012 09:00 AM".
  7. Download the logo for the race (if it exists).
  8. Resize the logo to be no bigger than 400x100.
  9. Copy and paste the logo centered on the image with the top at height 25.
  10. If the logo lacks an identifier of the year (i.e. "3rd Annual") feel free to add one if possible. I find doing this helps distinguish between badges for races that use the same logo from year to year:
  11. If there is no logo, create a text logo to fill this space.
  12. Change the drawing type to "Text".
  13. Change the font to "Courier New" and font size to "8".
  14. Locate the cursor at (200, 131).
  15. Type "Bib# " and the number of your bib.
  16. Change the font to “Arial Black”, font size to “24”, and text align to “left”.
  17. Locate the cursor at (1, 186).
  18. Type the distance of the race (i.e. "5K").
  19. The goal is to have 2 pixels between the text and the left and bottom borders. Move the text such that this is the case.
  20. Change the font to "Arial", font color to “red”, and text align to "right".
  21. Locate the cursor at (399, 187).
  22. Type in your average speed in MPH for the race. You could alternatively do average pace (minutes/mile). I'm not completely sure why, but I do seem to prefer MPH.
  23. Change the font size to "8", font weight to "bold", font color to "7f7f7f", and text align to "center".
  24. Locate the cursor at (x, 165) where x is the midway point between the leftmost point of the speed text and 397 (which should be the rightmost point). Usually I find the leftmost point to be at 337, so x would be 367.
  25. Type "MPH". Instead type "Pace" if you choose to do average pace.
  26. Change the font to "LEDFont", font size to "48", font weight to "normal", and font color to "007f00".
  27. Locate the cursor at (200, 180).
  28. Type in your chip time for the race. If there is a "1" in the time, I type a "7" (to keep things spaced nicely), I then erase the top line of the "7", and paste a "1" over it.

    What the time looks like with 1s:

    Same time but with 7s:

    Erase the tops of the 7s:

    Paste 1s over what's left of the 7s:

    The easiest way to accomplish that final part is to type a 1 anywhere on the image and drag it into place.

And that's all there is to it. Hopefully that's clear enough. If not, feel free to leave comments below, and I'll try to help you out and hopefully be able to improve these instructions.

Monday, November 5, 2012

NFL Playoff Picture: A Further Look Ahead

A bit of a nerdy precursor before I get started. I generate my playoff picture previews by running a software program I wrote that calculates what the playoffs would look like by iterating through all of the possible outcomes for the upcoming week. In a week without byes, there are 65,536 possibilities. It takes less than a minute to calculate all of those. Over two weeks with no byes, there are 4,294,967,296 possibilities which would take 7-8 days to calculate. Not really a reasonable time frame to report out on a week-by-week basis. With two less games in each of week 10 and 11, there are 268,435,456 possibilities that can be processed in 10-11 hours. Making now a good time to look ahead to how the playoff picture could look two weeks ahead.

This time, I'm going to start off with the NFC since it's a bit less exciting. Three of the four current division leaders are locked in through the next two weeks: the Giants, Falcons, and 49ers are all locked in. The Bears will most likely retain control in the North, but if they don't, they will have a wild card spot. The Packers will lead the North if the Bears don't. To overtake the Bears, the Packers will need the Bears to lose to both the Texans and 49ers (completely possible) while Green Bay must defeat the Lions in Detroit (the Packers have a bye in week 10).

9 of the remaining 12 NFC teams has a shot at being a wild card at the end of week 11. Only Philadelphia, Washington, and Carolina are too far out of the picture. The most likely wild card is the the non-division leader out of the Packers and Bears. That team is the wild card in 75% of the possibilities. The second most likely, not surprisingly, is the current #6: the Seattle Seahawks. The Seahawks take a spot in 50.33% of the iterations. The full list of percentages is:

1.Packers/Bears75.00%
2.Seattle Seahawks50.33%
3.Minnesota Vikings32.13%
4.Detroit Lions25.00%
5.Tampa Bay Buccaneers12.50%
6.St. Louis Rams2.34%
7.Arizona Cardinals1.10%
8.Dallas Cowboys0.88%
9.New Orleans Saints0.72%

Granted, the Rams, Cardinals, Cowboys, and Saints are all long shots, but the fact that they could move into a wild card spot in week 11 goes to show that by no means are any of them done.

Moving onto the AFC, there are more teams that don't have a shot at being in the picture after week 11 (the Bengals, Browns, Jaguars, Titans, and Chiefs) but none of the teams are locked in as division leader and only one (the Texans) is locked in as being part of the picture.

The AFC East will most likely be led by the Patriots (89.06% of simulations), but if they falter, the Dolphins (6.25%) and Bills (4.69%) are primed to take over. The Ravens are tops in the North in 62.50% of the possibilities with the Steelers taking the lead in the other 37.50%. The Texans at 93.75% will likely lead the South, but if not, the Colts are ready to take over. The West currently belongs to the Broncos (62.50%) but the Chargers could move to the top (37.50%).

With little clarity on who will be the division leaders, I think it's most useful to look at the wild card possibilities based on a team's probability to be one of the wild card teams when they aren't the division leader (i.e. the Texans are a wild card team in 6.25% of the iterations and were a non-division leader in 6.25% of iterations making them a wild card team 100% of the time they aren't the division leader.). The list of those percentages is (the likely division leaders are marked with an asterisk):

1.Houston Texans *100.00%
2.Baltimore Ravens *97.92%
3.Indianapolis Colts73.25%
4.Pittsburgh Steelers48.75%
5.Denver Broncos *42.71%
6.Miami Dolphins22.12%
7.San Diego Chargers20.47%
8.New England Patriots *18.69%
9.Oakland Raiders2.96%
10.Buffalo Bills2.23%
11.New York Jets1.12%

It's interesting (to me) to note that if the Broncos or Patriots stumble and lose their top spot, that they're more likely to completely fall out of the picture rather than just to drop into a wild card spot.

I found the two week projections to be interesting, but what will be more interesting will be to see which of these teams have fallen off of the radar after week 10 and then to see who actually has the spots in week 11 especially if it's one of the long shots.

NFL Playoff Picture: Week Nine

A bit more activity in the playoff picture than last week as the #5 seed on both sides exited the picture, the #6 seeds moved up to #5, and a couple of returning teams moved back in as the #6. Additionally the #3 and #4 on the NFC side flipped based on the loss by the New York Giants. As always, the following analysis is based on calculating any un-played games as ties.

Starting off in the AFC, the Patriots were on a bye but still maintained the lead in the East. The loss by the Dolphins to the Colts gave New England a one game lead. Up North, the Ravens survived a scare against the Browns to maintain a one game lead over the Steelers. The Texans knocked off the Bills to maintain a two game lead over the surprising Colts in the South. Out West, the Broncos defeated the Bengals and still hold a game lead over the Chargers.

The two Wild Card spots go to Pittsburgh and Indianapolis. The Colts take the #5 seed based on the slightly better conference record: 3-2 versus 2-3.

The Texans are still tops in the AFC based on record, and the same is true for the Ravens and the #2 seed. The Patriots and Broncos are tied at 5-3, but New England has the head-to-head victory. And so, the AFC playoff picture currently is:

As for the NFC, although they lost, as did everyone else from the division, the Giants still control the divisional lead. In the North, the Bears blew out Tennessee and still own a two game lead over the Packers. The 8-0 Falcons reign supreme in the South where they still own a four game lead over the Bucs. The 49ers were off this week but still lead the NFC West.

Green Bay has the best non-division leading record at 6-3 in the NFC and thus currently control the #5 seed. The #6 spot comes down to a tie between Minnesota and Seattle, and the Seahawks defeated the Vikings this weekend, and therefore have the spot.

All of the NFC divisional leaders have different records, so placing them in order is straight-forward: Atlanta, Chicago, San Francisco, then New York. Here's the current NFC picture:

For the second straight week, all of the divisional leaders are safe for next week. Additionally the Packers will be off on a bye and will hold onto the NFC's #5 seed.

Seattle will hold onto the NFC's #6 seed with a win. Otherwise the spot will go to the winner of Detroit @ Minnesota.

The AFC Wild Card spots are a bit more complicated. The current wild card teams (Indianapolis and Pittsburgh) as well as San Diego and Miami are the only candidates. The Colts keep a wild card spot with a win or a Chargers loss or a loss by both the Steelers and Dolphins. Pittsburgh keeps their spot with a win or a loss by both San Diego and Miami. The Chargers move into a wild card spot with a win and a loss by either the Colts or Steelers. And Miami take a wild card spot with a win and a loss by Pittsburgh and a loss by either Indianapolis or San Diego.

Week Ten is light on match-ups between teams in or trying to get in the playoff picture. Houston travels to Chicago in a match-up of the AFC's #1 versus the NFC's #2. The other game of interest (Detroit @ Minnesota) may not affect the playoff picture if Seattle can defeat the Jets at home. Fortunately, Week 11 looks like it will have much more for big match-ups.

Sunday, November 4, 2012

Back on the Weight Management Wagon

My biggest failure, goal-wise, for 2012 has to be in the area of weight management. I started the year in the mid-to-upper 170s with plans to get to my ideal weight which I estimated to be somewhere between 165-170. I started off the year strong getting my weight down to almost 170, but I got stuck where I couldn't break through to the 160s.

After a few frustrating weeks of being stuck around 171, I slacked off a bit and increased to around 173. I kept my weight in the lower part of the 170s until I went on vacation in June where I bounced up to the upper 170s. I made a bit of progress with renewed effort but kept having setbacks, and bounced back and forth between 175 and 180.

I started to make progress again when I started training for the Four Bridges Half Marathon and was in pretty good shape when I was derailed by a hamstring strain. From there, I seemed to quickly bulk up, and now a week after the half marathon, I'm close to the mid-180s. This has got to stop, now.

There are seven weeks left of 2012 (and unfortunately, a couple major eating holidays), but I have to get myself back to the upper 170s by end of year ... preferably around 177. I may have made that a bit more challenging these past couple days as I over-indulged knowing that I'd likely have to start dieting Monday. Additionally, I put off some yard work from today so that I'd have it available to do tomorrow (or Tuesday), so that I could get some calories back from the additional exercise.

Those couple of points have me a bit concerned that I'm not quite in the mindset needed for a successful weight loss. I guess it's a bit hard to be critical of my body after completing a half-marathon because, hey, I can't be in that bad of shape if I can run 13.1 miles. Which certainly is true, but I'd definitely be better off with a few less pounds.

So we'll see how it goes. At a minimum, if I force myself to record what I eat even if I overeat, I'll probably overeat by less just by knowing what I'm consuming.

My Where's George Week in Review: 10/28/12 - 11/03/12

In the past week, I received 26 hits in 8 States [CA18, HI, MD, NV, OR2, TX, VA, WA]. I still have hits in 44 States in 2012 with none added this week. Additionally I now have hits in 473 counties with 1 new this week: Salem City VA.

Of those 26 hits, 6 were the 2nd hit on the bill and the rest (20) were the initial hit on the bill. The longest bill active from the bunch was re-entered 3 Years 215 Days 15 Hours 55 Minutes after I originally entered it.

SundayMondayTuesdayWednesdayThursdayFridaySaturday
28293031010203
2562245

My current hit streak is now at 28 days tied for my 9th best all-time.

Taking a look at how my predictions regarding bill entries and hits are going so far, it was a positive week for all three stats (although it didn't feel like it for total hits and bills with hits):

 SoYStart of YearSoWStart of WeekEoWEnd of WeekWeek Change:
Number Added this Week
Year Change:
Number Added this Year
PPrediction (for Year)P/WPrediction for Week:
A Week's Share of the Total
PtDPrediction to Date:
The Portion of the Prediction that should be Completed so Far
WvPWeek versus Prediction:
How the Week's Numbers Stack Up Against the P/W
DvPDate versus Prediction:
How the Year's Numbers So Far Stack Up Against the PtD
Bills Entered16720220572216510854452172095.620928+12+1237
Bills with Hits243034863506201076344519.43284+1+222
Total Hits279940614087261288403023.53835+2+252

Based on the goal of 5000 bill entries, here's how I'm doing towards my bill entry goals. Starting off with my goal of increasing the percentage that $1s make up of my entries by 1% (started the year at 86.29% so the goal is 87.29%), my percentage is now 87.48% [+1.19%]. Ones are really dominating my entries currently, and I don't foresee that changing until I start Christmas shopping (assuming I don't do the majority of it online).

 SoYStart of YearSoWStart of WeekEoWEnd of WeekWeek Change:
Number Added this Week
Year Change:
Number Added this Year
GGoal:
Number of Total Ones Needed by the End of the Year Based on the Prediction of 5000 Bill Entries This Year
GfWGoal for Week:
This Week's Portion of the Goal Based on the Number of Bills Entered in the Week
GtDGoal to Date:
The Numbers of One Needed to be Entered so Far this Year to be on Track to Met the Overall Goal
WvGWeek versus Goal:
How the Week's Numbers Stack Up Against the GfW
DvGDate versus Goal:
How the Year's Numbers So Far Stack Up Against the GtD
$1s Entered14427192861939110549641895997.919362+7+29
Dynamic GoalProgress towards the goal based on my actual rate of entering bills per day which would result in 6471 entries this year rather than 50002024397.119321+8+70

As for the goal of having series 2009 pass series 2003A in number of entries, my 2003A entries seem to be increasing slightly (nowhere near what would be needed to catch back up to 2009) but 2009 continues to extend it's lead:

 SoYStart of YearSoWStart of WeekEoWEnd of WeekWeek Change:
Number Added this Week
Year Change:
Number Added this Year
  Week Change:
Number Added this Week
Year Change:
Number Added this Year
WvGWeek versus Goal:
How the Actual WΔ Stacks Up Against the Goal WΔ
DvGDate versus Goal:
How the Actual YΔ Stacks Up Against the Goal YΔ
2003A3603385238597256GoalNumber of Entries Needed Per Timeframe to Stay on Pace for the Year Based on the Predicted Amount of 5000 Bills Entered492467+14+610
2009133946024672703333Actual633077

And for my goal of decreasing San Francisco "L" FRB entries below 50.0% while increasing Boston "A", Cleveland "D", St Louis "H", Philadelphia "C", Minneapolis "I", and Kansas City "J", only Philadelphia and Minneapolis went the wrong way, but not by enough for it to be a concern:

 SoYStart of YearSoY%Percentage of Overall at Start of YearSoWStart of WeekSoW%Percentage of Overall at Start of WeekEoWEnd of WeekEoW%Percentage of Overall at End of WeekGoalGoal PercentageGtDGoal to Date:
The Numbers Needed to be Entered so Far this Year to be on Track to Met the Overall Goal
DvGDate versus Goal:
How the Year's Numbers So Far Stack Up Against the GtD
San Francisco "L"853251.03%1054347.80%1059347.79%< 50.0%49.94%11052+459
Boston "A"4612.76%7583.44%7623.44%> 2.8%2.85%634+128
Cleveland "D"3952.36%7773.52%7833.53%> 2.4%2.45%545+238
St. Louis "H"3822.28%7143.24%7193.24%> 2.3%2.35%522+197
Philadelphia "C"3762.25%6372.89%6392.88%> 2.2%2.25%499+140
Minneapolis "I"3522.11%5952.70%5952.68%> 2.1%2.15%477+118
Kansas City "J"2901.73%5502.49%5522.49%> 1.7%1.75%389+163

October finished with 113 hits tying February for second-worst total hits in 2012. November isn't off to a hot start, but it's really too early to comment on how it will end up.